Residential Key Findings
- Around three quarters of all vacant lots over the last 5 years have consistently been residential lots.
- Residential lots contribute between 96% and 99% of all lots created.
- Residential lots contribute between 92% and 97% of all lots sold.
- The availability of all vacant land was on an increasing decline over the past 6 years, however the 2017-18 results show a possible stabilising effect.
- The creation of new lots across all types has increased overall by 144.9% over the past 5 years, largely due to the spike of residential lots created in the 2017-18 period - attributing to 98.5% of all lots produced.
- Vacant lot sales have only increased marginally over the past 5 years (4.0%), however the fluctuation of sales over the last 6 year period needs to be considered before passing judgement, as the market appears to alternate each year between a peak and trough.
- The 2017-2018 period saw a further explosion of new residential lots with 591 lots created. This compares with the number of lots created for the four years prior of between 236 and 372 lots created per year. The creation of residential lots appears to be rising at an exponential rate, up 59% from the 2016-17 period, and more than double (113%) the 2015-16 period. While this appears as a positive for the City of Wodonga, vacant lot sales have declined, which further reiterates comments made in the previous two LDT Reports that close monitoring of lot production and vacant lot sales is required to detect and abate where possible any over-supply of vacant residential land. It would be advisable to check with local real estate agents and developers as to the demand for vacant land or house and land package sales. Declining sales with a surge of vacant lots produced may not be a natural cycle fluctuation, but could be an indication of a present over-supply.
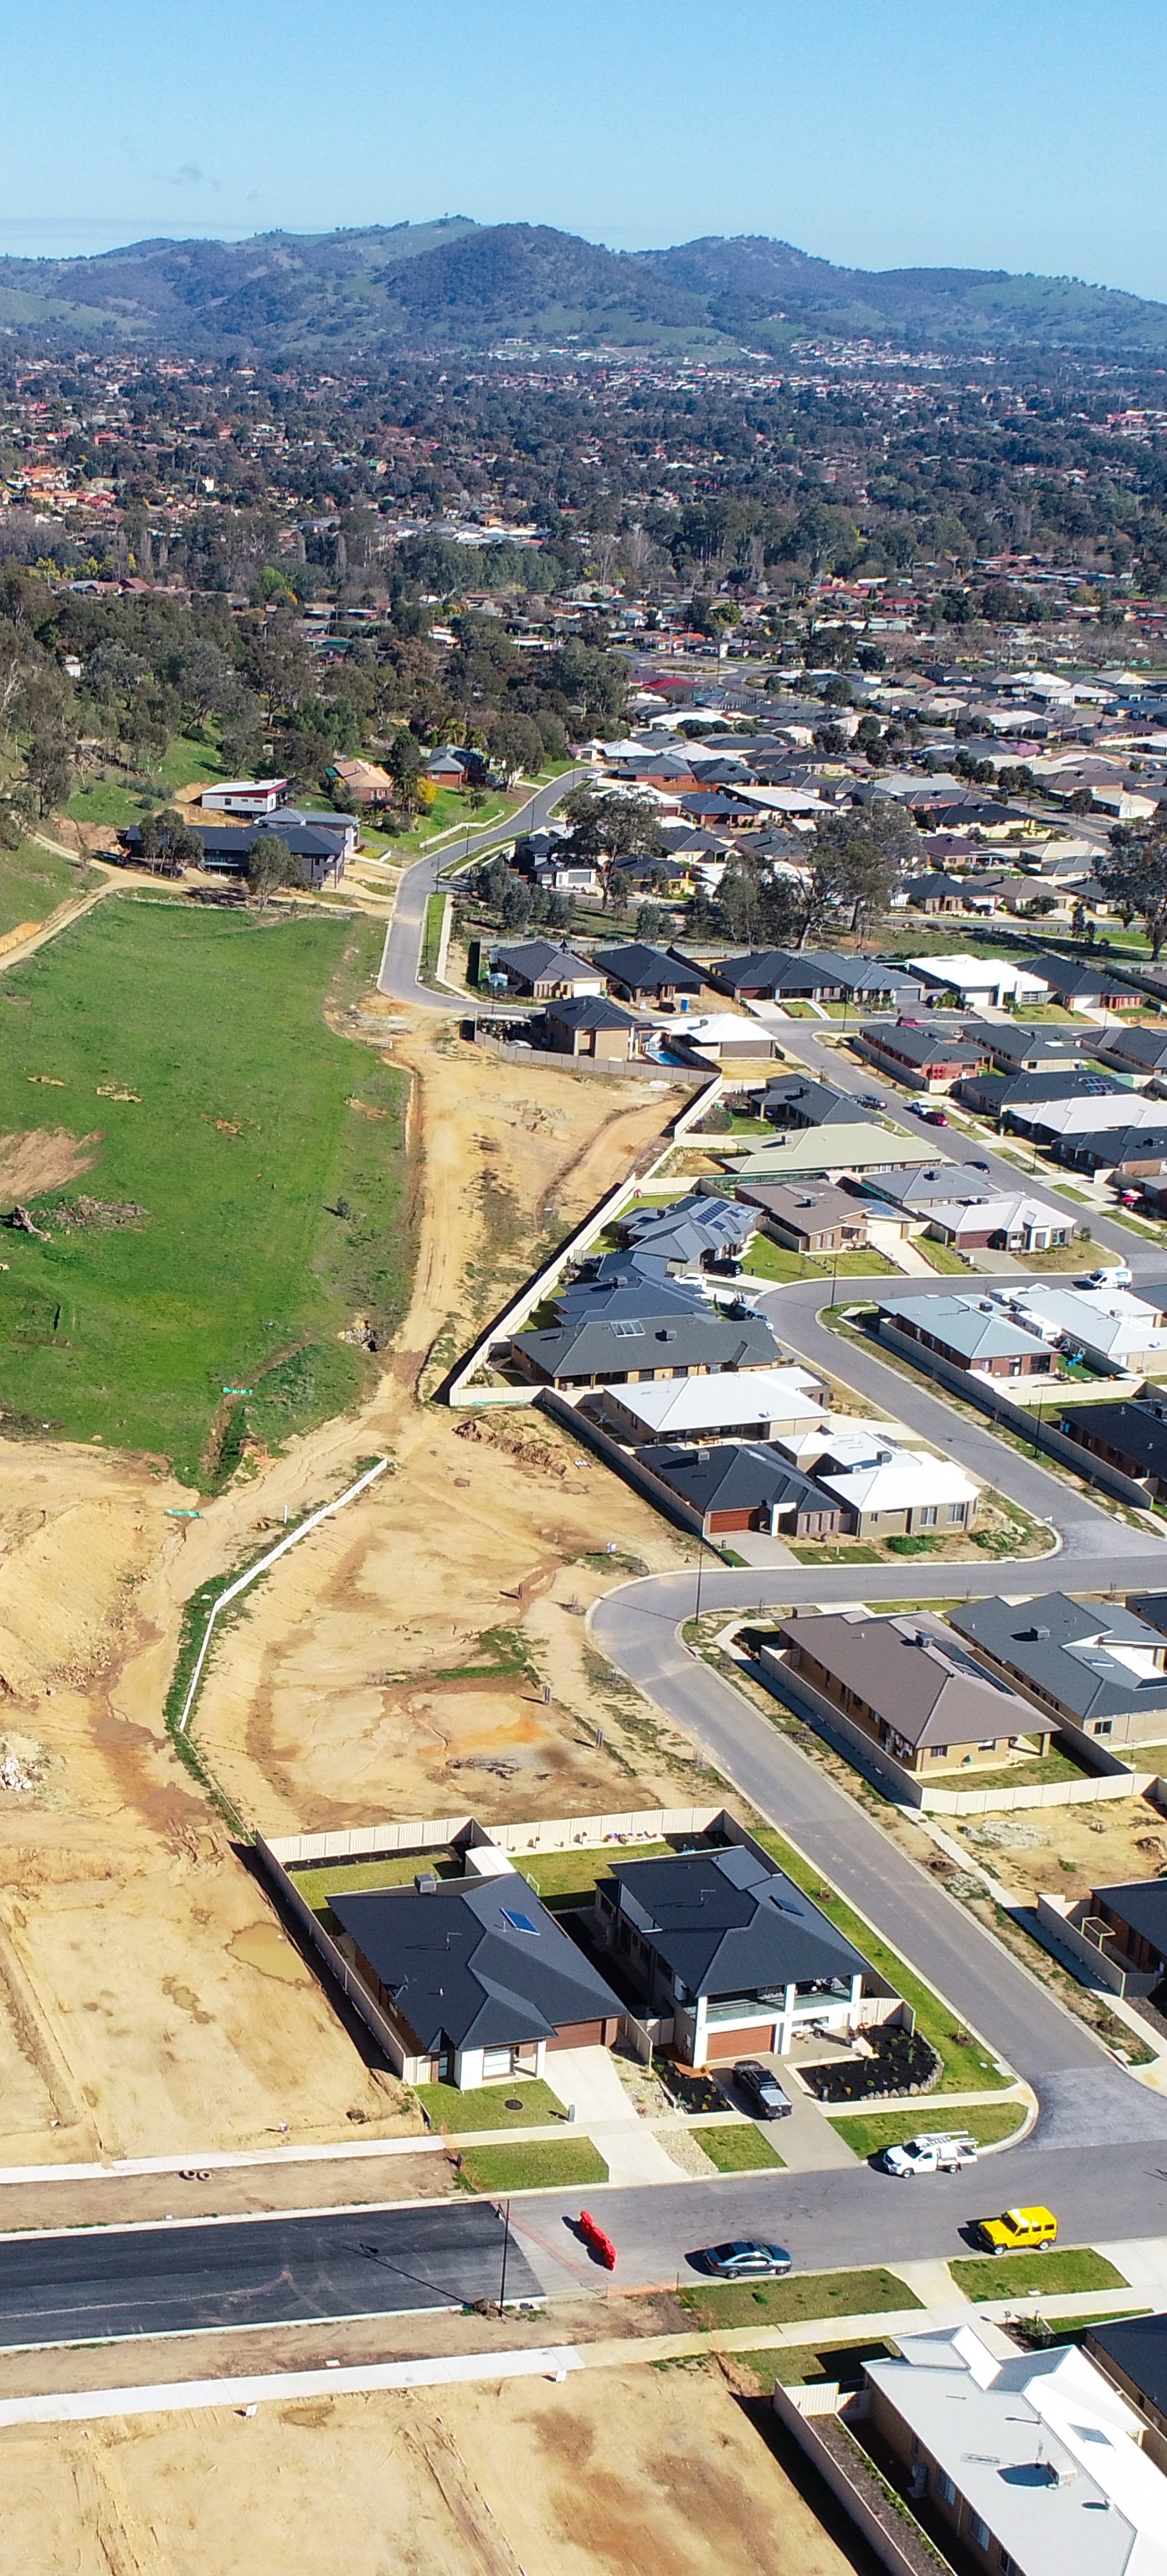
- The distribution of vacant land is dispersed throughout the municipality, with expected concentrations of vacant land in newer residential estates and outer Sectors.
- The market yet again was dominated by residential lots being created within the Central South Sector (Whitebox Rise) during the 2013-2018 financial year periods - 514 lots created, approximately 25% more than that of its nearest competitor, the East Sector (Riverside Estate) - representing 30% of all residential lots created. The East Sector has also had a surge over the 2017-18 period, more than doubling (131%) its previous 4-year average of 65.25 lots produced.
- The leading Sectors contributing to additional residential lots over the 2013-2018 financial year periods were Central South (514 lots, or 29.8% of the market), East (412 lots, or 23.9% of the market), South (231 lots, or 13.4% of the market), Outer South East (206 lots, or 11.9% of the market), and Outer West (199 lots, or 11.5% of the market). These Sectors represent 90.4% of all lots created. The Central South Sector (Whitebox Rise) over the 2017-18 period has lost market share to its competitors, yet still maintains the greatest volume of lots produced.
- The average lot area of all residential lots created during the 2013-18 financial year period was 1,846 square metres, or just under half an acre. This represents a 2 square metre drop from 1848 square metres in the average area from the 2012-17 period.
- Five of the thirteen Sectors have shown sales in excess of 100 lots for the 2013-18 period, representing 86.3% of all sales over the period.
- Again, the Central South Sector has dominated sales, accounting for nearly 28% of all sales. The East and South Sectors have also been fairly strong, contributing 21% and 17% respectively. The Outer West an Outer South East Sectors round out the top-5 with approximately 12% and 9% respectively.
- Residential vacant lot sales appear to be waning, with the 2017-18 result approximately 5% below the 5-year average of 422 sales.
- For the third year in a row, the Central South Sector (Whitebox Rise) has been in decline with its sales run, down marginally from the 2016-17 period (-6.7%) and down significantly from its 2014-15 period high (-38%). This is despite a marginal increase (<5%) in lots produced in 2017-18.
- All Sectors with a significant volume of sales, with the exception of the South West Sector, have been in a sales decline over the 2017-18 period. While the South West Sector has shown an increase, it's nothing to get too excited about yet, as sales are only up by 10 lots in the 2017-18 period from 25 sales in the 2016-17 period (+40%), although there has been a consistent increase in sales every year since the 2013-14 period.
- As expected, the average value of vacant lots is greater in the outer regions of the municipality, such as in the low density residential zones or the rural living zones, as land sizes are much larger than their general residential zoned counterparts.
- A better indicator of land 'value' is the measure of the average dollar per square metre cost of vacant land. While this measure is somewhat subjective due to available infrastructure in the area, proximity to other services, neighbourhood character, personal preference of land purchasers, etc, when these external factors are common, the comparison of dollar per square metre land costs is a very good indicator of value for consumers. The average figures for the 2013-18 period show a diversity of desirability across the municipality, where East and Outer West Sectors appear comparatively desirable with Central, Central East and Central South Sectors.
- The average dollar per square metre rate over the 2013-2018 financial year period across all residential vacant land sales was $181 per square metre, a marginal increase from the 2012-17 period ($180 per square metre), and a slightly larger increase from the 2011-2016 financial year period ($176 per square metre).
- With restructuring Wodonga's analysis into Sectors, rather than ambiguous residential estates as previously used, a greater capture of residential activity has resulted with less than 5% of building approvals falling outside a designated Sector (classified as "UNALLOCATED"). This should provide greater reliability of results.
- The Central South Sector (Whitebox Rise) again stands out as the highest performing Sector for both volume of building permits issued and accrued permit value, or capital investment with 23% and 21% of market share respectively, approximately 52% and 31% respectively greater than that of its nearest competitor, the East Sector (Riverside). While this is an increase from the 2016-17 LDT results (18% and 17% respectively), it still represents a drop in market share for the Central South Sector since the 2015-16 LDT analysis where it enjoyed 27% and 24% of volume and accrued capital investment respectively. The Outer West, South, Outer South West and Central Sectors came in as the next performing regions with 10.9%, 9.1%, 7.5% and 7.4% respectively.
- The 2017-18 period has seen an increase of building approvals after a consistent decline over the preceding 4 years. The increase in building approvals from 2016-17 to 2017-18 has been largely due to the Sectors: South West (+22); Outer South East (+20); West and Outer South West (+19 each).
- It would also appear the southern regions of Wodonga are attracting larger home construction, with average estimated building costs well above the overall average. The South West Sector ranking highest with an average estimated building cost of just under $340,000, the Outer South West at nearly $304,000, South at $280,000 and Central South West at just under $269,000. These are respectively 32.8%, 18.7%, 9.5% and 5.1% above the average estimated building cost.
- The financial year periods from 2013-2018 saw an investment in residential construction of nearly $690M, averaging approximately $138M per year, and an average estimated build cost of $256,000.
- Nearly a third (29.2%) of all building approvals for the 2013-2018 periods were for properties within the Central South Sector, and nearly a fifth (19.2%) attributed to those in the East Sector, or nearly 50% between the two Sectors. the Outer West and South Sectors were the next highest performers at 11.0% and 10.6% respectively.
- Just under half of the estates (6 of the 14 Sectors) recorded more than 100 occupancy permits issued for new dwellings over the 2013-2018 financial year periods, and 5 Sectors recorded less than 20 occupancy permits issued for new dwellings. Again, as expected, the Central South Sector dominated, but appears to be showing a decline in its year-on-year results from a 2015-16 high of 133 occupancy permits issued (-19.5% over 2 years). This is in contrast to the East Sector which has shown a steady increase of occupancy permits issued since 2014-15 (+70.9% over 3 years).